

Overview
Explore engagement, demographics, survey flow, and form-specific feedback intelligence
Overview brings the most important signals for one form into a single workspace. Summary cards remain visible while you move between Feedback Intelligence, Engagement, Demographics, and Survey flow.
Open a form, select Results, and then select Overview.
Summary cards
The cards at the top summarize activity for the selected date range, filters, and form version. They include response and view counts, a user breakdown, and supporting detail such as logged-in users versus visitors.
When trends or a comparison range are enabled, the cards also show how the current values changed over time or against the comparison period.
Overview tabs
| Tab | What it helps you understand |
|---|---|
| Feedback Intelligence | Topics, aspects, sentiment, mentions, and common terms found in written answers for this form. |
| Engagement | Views, submissions, response or completion behavior, and how activity changes over time. |
| Demographics | Response distribution by channel or device OS, language, and country. |
| Survey flow | The path through the form, question-level drop-off, and time spent on each question. |
Feedback Intelligence
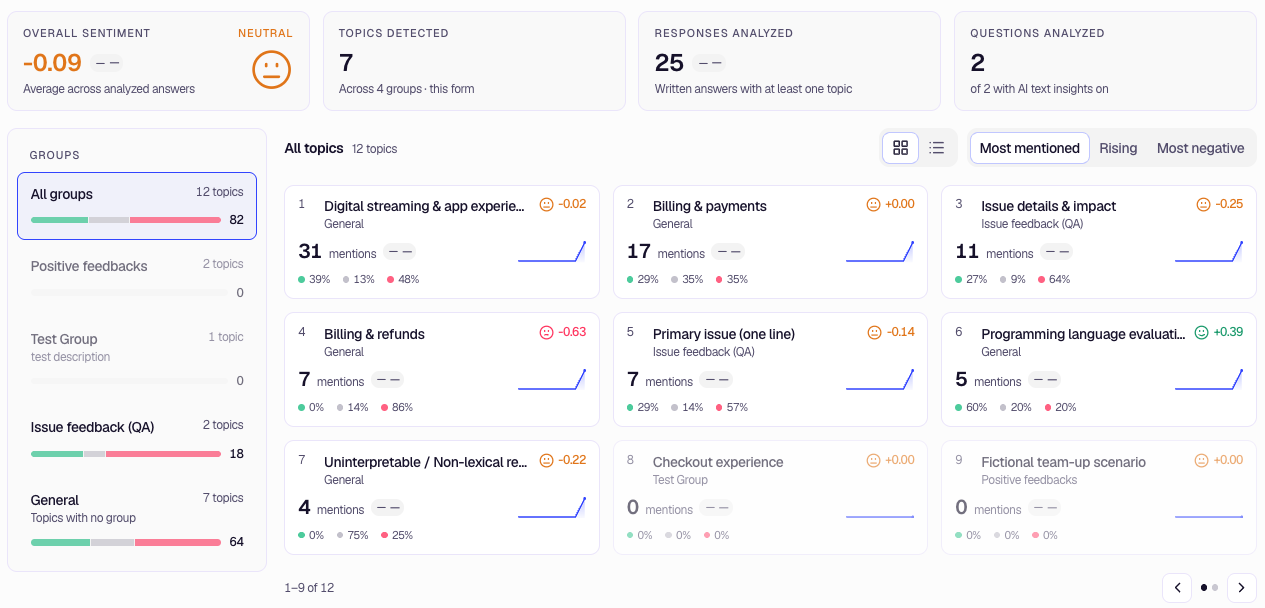
This is the form-specific view of Feedback Intelligence. It follows the Overview date range, filters, comparison, trend unit, and selected form version.
The tab shows analyzed responses and mentions, topic and sentiment changes, the questions contributing written feedback, and a word cloud. Select a topic to inspect its aspects and the responses behind it.
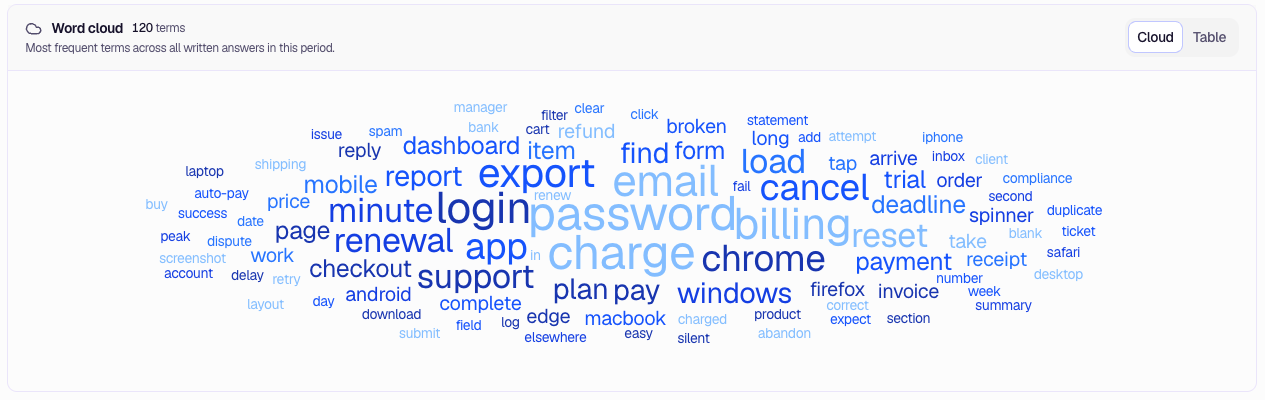
The Word cloud highlights the terms used most often across written answers in the selected period. Switch from Cloud to Table when you need a structured list of terms and frequencies.
The tab appears when Feedback Intelligence is available and you are viewing live data. Written-answer questions must have AI text insights enabled before new answers can be analyzed. If the tab is unavailable, Overview opens on Engagement instead.
For project-wide analysis across forms, see Feedback Intelligence.
Engagement
Use Engagement to review views, submissions, response rate, and completion-time behavior. Where a chart supports it, switch between its summary and over-time presentation or between the available chart styles.
The selected trend unit controls the time buckets used by sparklines and over-time charts. Auto chooses a suitable unit for the date range, or you can select hour, day, week, or month when the range supports it.
Demographics
Use Demographics to understand where responses came from. It includes channel or device OS, language, and country distributions. Metadata-dependent charts may show an uncaptured category when the form did not receive that context.
Enable a trend unit to see how the leading categories changed across the selected period.
Survey flow
Survey flow includes:
- Question flow — How respondents moved from the start of the form through its questions and exits.
- Question drop-off — Where respondents stopped progressing.
- Time Spent per Question — Completion-time distribution for each question, including percentile values where available.
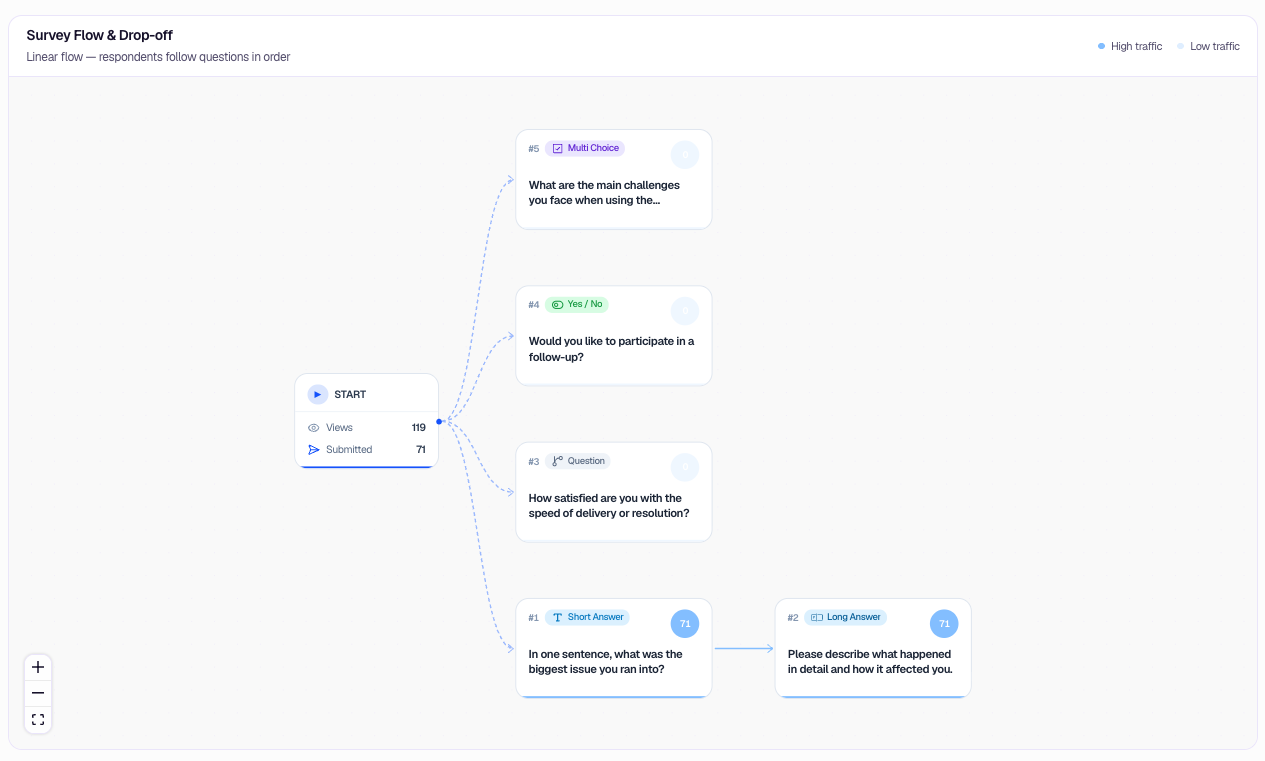
The Survey Flow & Drop-off diagram maps the paths respondents followed. Each question node shows its type and reach, while the connecting lines distinguish higher- and lower-traffic paths. Use the zoom and fit controls to inspect larger forms.
The Question Drop-off chart compares how many respondents reached each visited step. The faded extension represents the previous step's reach, making the gap where respondents dropped off easy to see.

The Time Spent per Question chart shows the median time respondents spent on each visited question, helping you identify steps that may require more effort or cause hesitation.

Use this tab to find confusing questions, unexpected branches, and points where respondents abandon the form.
Scope the analysis
Use the toolbar to control what Overview includes:
- Date range — Choose a preset period or custom date and time range.
- Add Filter — Filter by captured properties or by answers to form questions. Applied filters can be edited or removed from their chips.
- Trend unit — Turn trends off, choose Auto, or select a supported time unit.
- Form version — View all versions or isolate a published version. The questionnaire labels follow the live version unless a version is selected.
- Compare to — Compare the current period with a previous period or another date range.
Filters and summary cards stay in place while you switch Overview tabs.
Reuse and share the view
- Use Dashboard presets to save the date range, filters, selected version, comparison, trend unit, and chart color theme.
- Use Refresh or configure automatic refresh when you are monitoring incoming responses.
- Use the chart theme control to change the report palette.
- Use Print overview to print the summary cards and the currently open tab.
See Dashboard Presets for details about saving and reopening report configurations.
Was this page helpful?